
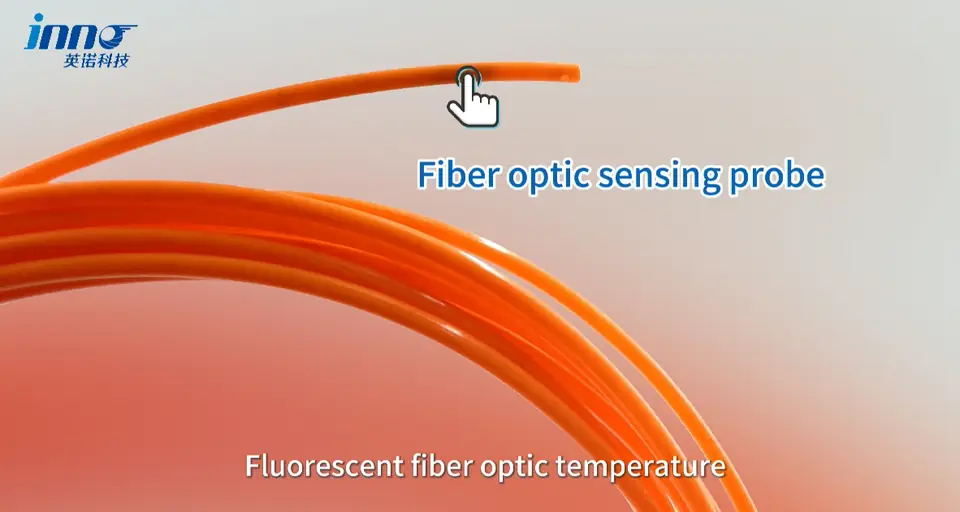
- Fiber optic temperature sensor response time describes how quickly the measured temperature follows a real temperature change at the sensing point.
- Typical INNO fluorescence configurations provide a response of <1 s for standard configurations.
- Installed response can differ from the datasheet value, because thermal contact, probe construction and the measured medium all affect how heat reaches the sensing tip.
- Response time is not the same as sampling rate, instrument update rate or display refresh rate.
- Smaller probes with good thermal contact can generally follow temperature changes faster than heavier or poorly coupled installations.
- Fast response matters most when the temperature itself changes quickly enough for the difference to matter.
What Fiber Optic Temperature Sensor Response Time Actually Means
Response time answers a simple question: after the temperature at the sensing point changes, how long does the reading take to follow it? That sounds like a property of the sensor alone, yet the number an operator sees on a PLC screen is the end of a longer chain. A physical temperature change has to transfer heat to the probe, the probe has to respond thermally, the instrument has to make a fluorescence measurement and process the signal, and the result then passes through instrument update and communication before it appears on a PLC, SCADA or DAQ display.
Sensor response time in the strict sense covers only the middle of that chain, meaning how the probe follows temperature at its own location. For INNO fluorescence point sensors this is typically <1 s for standard configurations. That figure describes the probe under defined conditions, while the thermal response in an actual installation depends on the probe structure and the measurement setup. Engineers who read a single number in a datasheet and assume the whole monitoring system will update at that speed are usually treating several different quantities as one.
Why the Datasheet Response Is Not Always the Installed Response
A datasheet response value is measured under defined test conditions, with a known heat-transfer arrangement between the probe and its surroundings. Once the probe is fixed to a real surface, embedded in a component or immersed in a medium, the installation adds its own thermal path. The probe itself has not become slower, but the heat now has further to travel or a poorer interface to cross before it reaches the sensing tip.
A simple engineering example shows the effect. Two identical probes can show different apparent response in two installations if one probe has direct, firm contact with the target and the other is separated by an air gap or a thick mounting layer. A probe may have a fast intrinsic thermal response, but poor contact with the target adds another thermal resistance between the surface and the sensing tip. The instrument then reports the probe temperature correctly while the probe takes longer to follow the target. For surface measurements, installation quality can matter as much as the response value printed in the sensor specification.
What Determines How Quickly the Probe Follows Temperature
The measurement itself is made at a small sensing tip. In fluorescence fiber optic temperature sensing, excitation light travels down the fiber to a fluorescent sensing material, and the returned fluorescence forms a decay waveform. The instrument derives the fluorescence lifetime from that waveform and converts it to temperature through a calibration relationship, so temperature comes from decay lifetime and not from light intensity. One probe represents one defined physical sensing point. It does not measure along the fiber like distributed temperature sensing, and it does not locate unknown hot spots by itself. The thermal behavior that matters most is therefore that of the tip and of whatever sits between the tip and the target.
Probe diameter is the first factor. Standard probes are 2–3 mm in diameter, configurable, and a smaller sensing tip generally has lower thermal mass, which helps it follow temperature changes more quickly. Diameter alone does not give a time constant, however, and it should not be used to calculate one. Probe construction is the second factor. Protective layers, packaging, insulation and mechanical structure all form part of the path that heat takes to reach the sensing material, and added protection may slow the response in some constructions without making that an absolute rule.
Thermal contact and the measured medium then decide how much of the probe's intrinsic response survives in practice. Contact pressure, mounting method, air gaps and probe location all affect the surface case. Moving liquid, still liquid, air, a solid surface and an embedded position each present a different heat-transfer condition to the probe, so the same probe can behave differently in each.
| Factor | Why It Matters | What Engineers Should Check |
|---|---|---|
| Probe diameter | A smaller tip generally has lower thermal mass | Available space at the measurement point against the 2–3 mm configurable range |
| Probe construction | Sheath and packaging form part of the heat path to the sensing material | Whether the protection level the environment requires is also acceptable for the thermal process |
| Thermal contact | Air gaps and thick interface layers add thermal resistance | Firm contact with the target and a probe location that represents the point of interest |
| Measurement medium | Air, liquid, solid surfaces and embedded positions transfer heat differently | Flow condition, immersion depth and surrounding material |
| Mounting method | Fixing structures can add mass or insulate the tip from the target | Whether the fixing method preserves direct contact over repeated cycles |
| Instrument update | The instrument produces new results at its own rate | The update rate stated for the specific monitoring instrument |
| Communication / host polling | Host systems read data at their own interval | PLC, SCADA or DAQ polling interval against the temperature change being observed |
Sensor technology alone does not determine response time, because physical construction and installation matter substantially. A thermocouple, an RTD and a fiber optic probe can each respond quickly or slowly depending on size, sheath, mounting and medium, which is why comparisons such as fiber optic temperature sensor vs PT100 and fiber optic temperature sensor vs thermocouple are better read for electrical isolation, interference and installation questions than for a single speed ranking.
Response Time vs Sampling Rate, Update Rate and Resolution
Sensor response time, sampling rate, instrument update rate, display refresh rate and communication polling rate are separate quantities, and a system can be fast in one and slow in another. Sampling rate describes how often the measurement electronics acquire or process the signal. Update rate describes how often the instrument outputs a new measurement result. Display refresh describes how often the screen redraws, and communication polling describes how often a PLC, host computer or software reads the device. A probe with a fast thermal response can sit behind a host that polls slowly, and a high update rate does nothing to speed up a probe that is thermally lagging behind its target.
Response time should also be separated from accuracy and resolution. Fast response does not automatically mean high accuracy, and high resolution does not automatically mean fast response. A reading that follows a temperature change quickly can still be offset from the true value, and a reading displayed to 0.1°C can still arrive late. Response time belongs next to the fiber optic temperature sensor range, accuracy and resolution rather than being treated as an isolated specification.
| Specification | What It Describes |
|---|---|
| Response time | How quickly the measurement follows a temperature change at the sensing point |
| Sampling rate | How often the measurement electronics acquire or process the signal |
| Update rate | How often the instrument outputs a new result |
| Display refresh / host polling | How often the screen redraws or the host reads data from the device |
| Accuracy | How close the reading is to the actual temperature, ±0.5°C to ±1°C depending on configuration |
| Resolution | The smallest temperature increment the system represents, 0.1°C |
| Range | The lowest to highest supported measurement temperature, −40°C to +260°C |
Instrument-side behavior depends on the particular device, so update rate and communication options differ between fiber optic temperature monitoring systems. The figures belong to the instrument specification and should be read there rather than inferred from the probe response.
How Installation and Measurement Medium Affect Response
Surface measurement depends most heavily on thermal contact. The probe tip has to touch the target firmly, because any air gap or compliant layer becomes a thermal resistance that the heat must cross before the tip can follow. Embedded measurement places the probe closer to an internal point of interest, but the surrounding material and the way the probe is fixed still shape how heat reaches the tip. Practical points such as surface contact, probe positioning, mechanical fixing and avoiding unintended air gaps are part of fiber optic temperature sensor installation, because the thermal path between the target and the sensing tip affects the observed response.
Air and liquid measurements behave differently from solid contact. Heat transfer between air and a probe is generally different from heat transfer through direct contact, and in liquids the flow condition and the immersion of the probe change what the tip experiences. No fixed response-time number can be given for each medium without testing the actual arrangement, which is why a specification value should be read as a reference condition and not as a promise for every installation.
Fiber Length Is Not Response Time
Fiber length and thermal response time are different selection parameters. Fiber length is a routing parameter, and fiber optic temperature sensor fiber length should be selected from the physical distance between the probe and the instrument. It should not be assumed to define thermal response, and a longer fiber should not automatically be read as a slower sensor. The probe's thermal response is mainly associated with the sensing tip and its thermal coupling, while the rest of the behavior follows the sensing principle and the instrument architecture.
When Does Fast Temperature Response Matter?
Faster is not always better, and not every temperature application needs the quickest possible response. Fast response matters most when the temperature changes quickly enough that a lag in the reading would hide or distort the event being studied. Laboratory testing, transient thermal tests, power electronics tests, rapidly changing process conditions, comparisons during load steps, RF and microwave heating tests and experimental setups are typical examples. In those cases a probe that follows the real temperature closely lets the engineer see the thermal behavior as it develops.
Slowly changing assets are a different case. For transformer windings, busbars and other long-term condition monitoring, measurement stability, probe placement, accuracy and reliability can matter as much as sub-second response, or more. A <1 s response is still an advantage there, but it is rarely the deciding specification. The required response should follow the thermal process being measured.
How to Evaluate Response Time When Selecting a Fiber Optic Sensor
Evaluation starts with the thermal event. Engineers should know how quickly the temperature at the measurement point can actually change, since a sensor only needs to be fast relative to that process. From there, the response value should be read together with the conditions it was stated for, then compared with how the probe will really be mounted, with the medium it will sit in, and with the update and polling behavior of the instrument and host system. The measurement point comes first, followed by the thermal contact, the instrument chain and finally the sensor value.
For many applications a standard fluorescence fiber optic temperature probe is the usual starting point, with the standard configuration giving a response below 1 s. Projects with unusual probe dimensions, a demanding measurement medium or a tight response requirement benefit from describing the real installation early, because that is where the datasheet value and the installed behavior diverge. More background on the measurement approach is collected under fiber optic temperature measurement, and the full range of probe types sits under fiber optic temperature sensors.
Evaluating Response Time in the Real Measurement Setup
A datasheet response is one part of the measurement chain. Actual behavior depends on probe construction and thermal coupling at the measurement point, and the reading that reaches a PLC or DAQ also passes through instrument update and communication. Response time, sampling rate and update rate describe different things and should not be exchanged for one another.
Fast response is valuable where the temperature changes quickly, and less decisive where it drifts slowly over hours. The right question is whether the probe, installed as planned, follows the thermal process that matters for the test or the asset. For projects that need a configuration chosen around temperature range, probe dimensions, response requirement, measurement medium and installation location, the INNO engineering team can review the setup together with the application.